tree

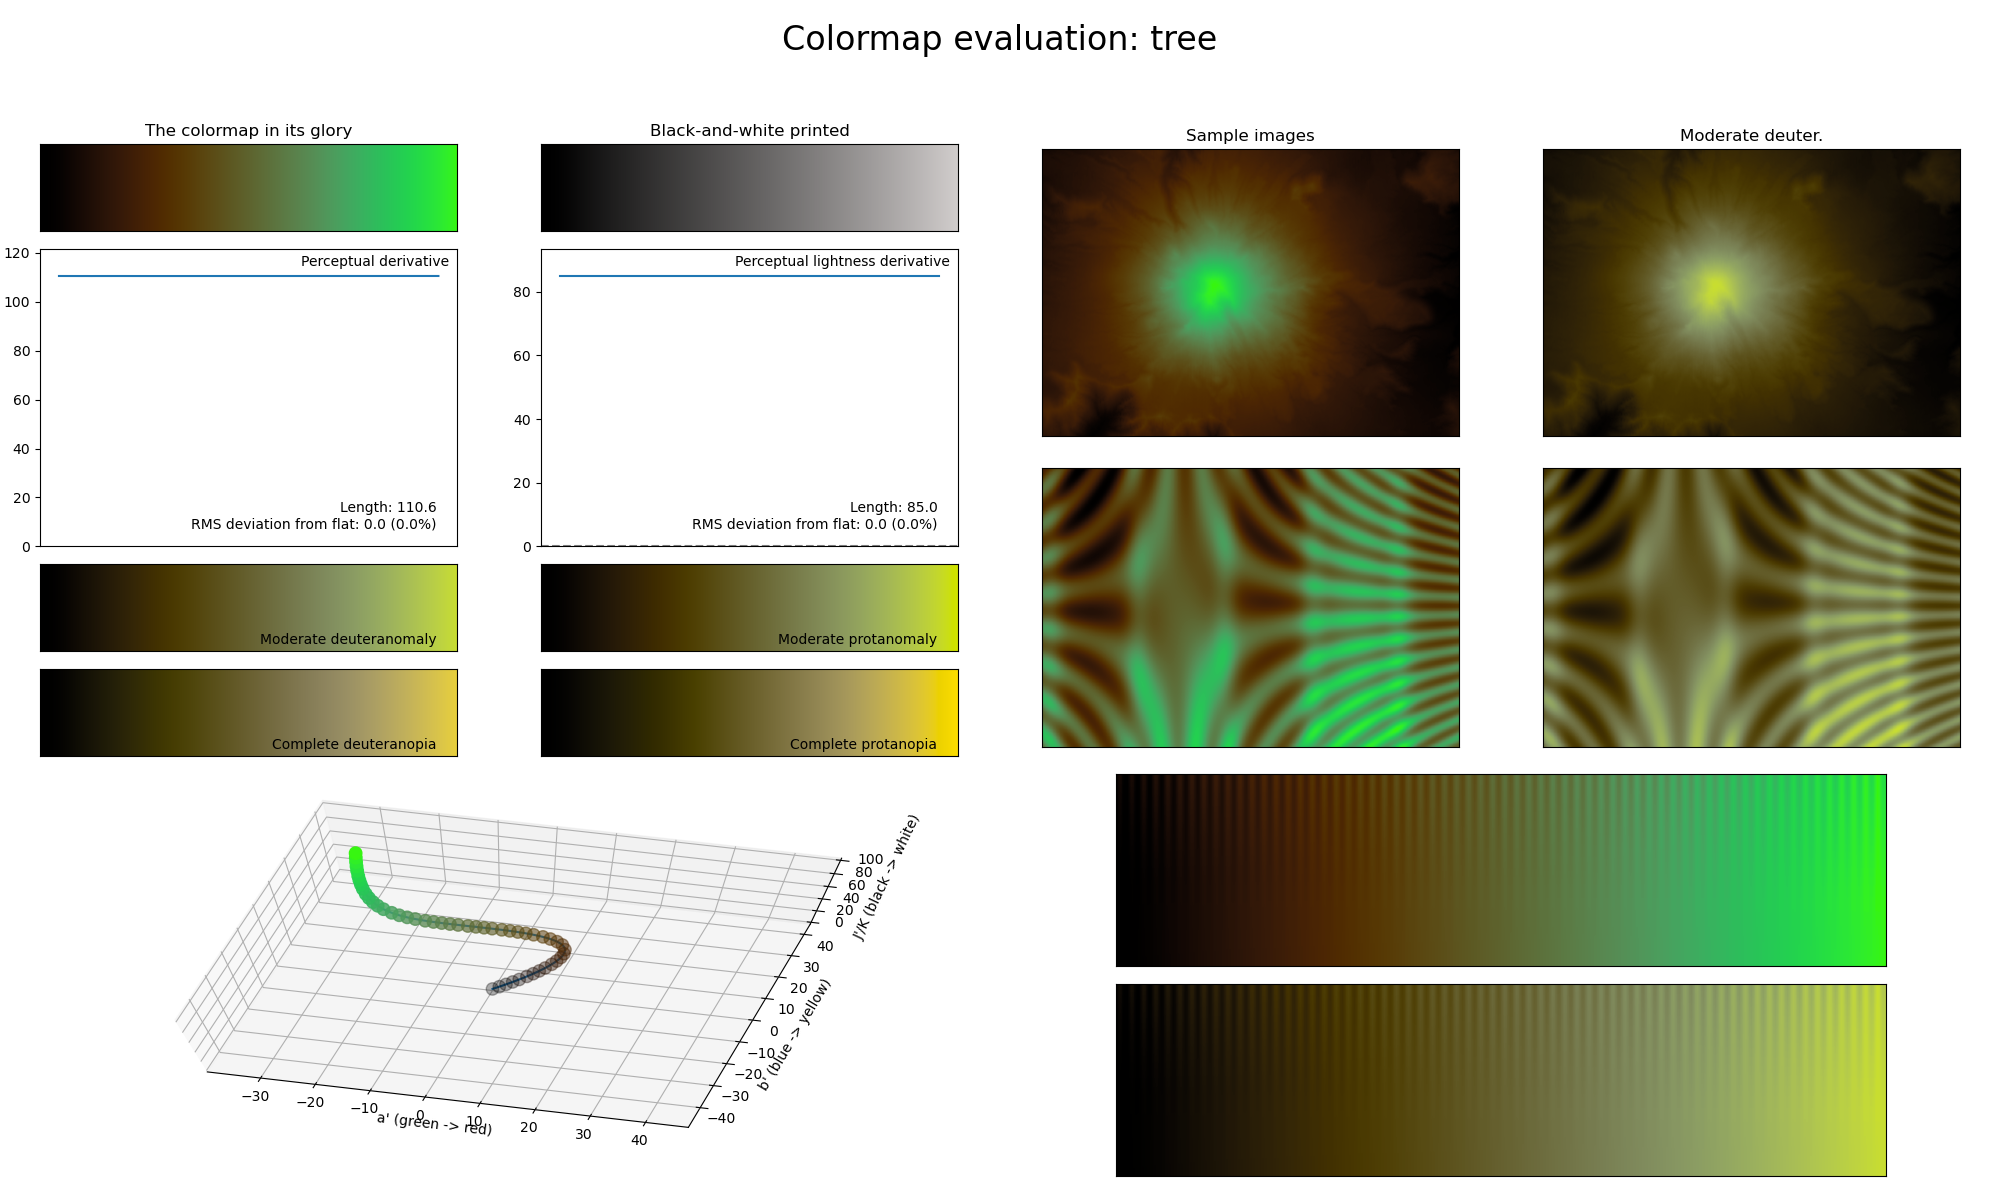
The tree colormap is a visual representation of the woody plants with the same name (there is, funnily enough, no accepted definition of what a tree is). It covers the \([0, 85]\) lightness range and uses the colors green and brown. This colormap is excellent for representing information where the higher values should be the main focus.