redshift

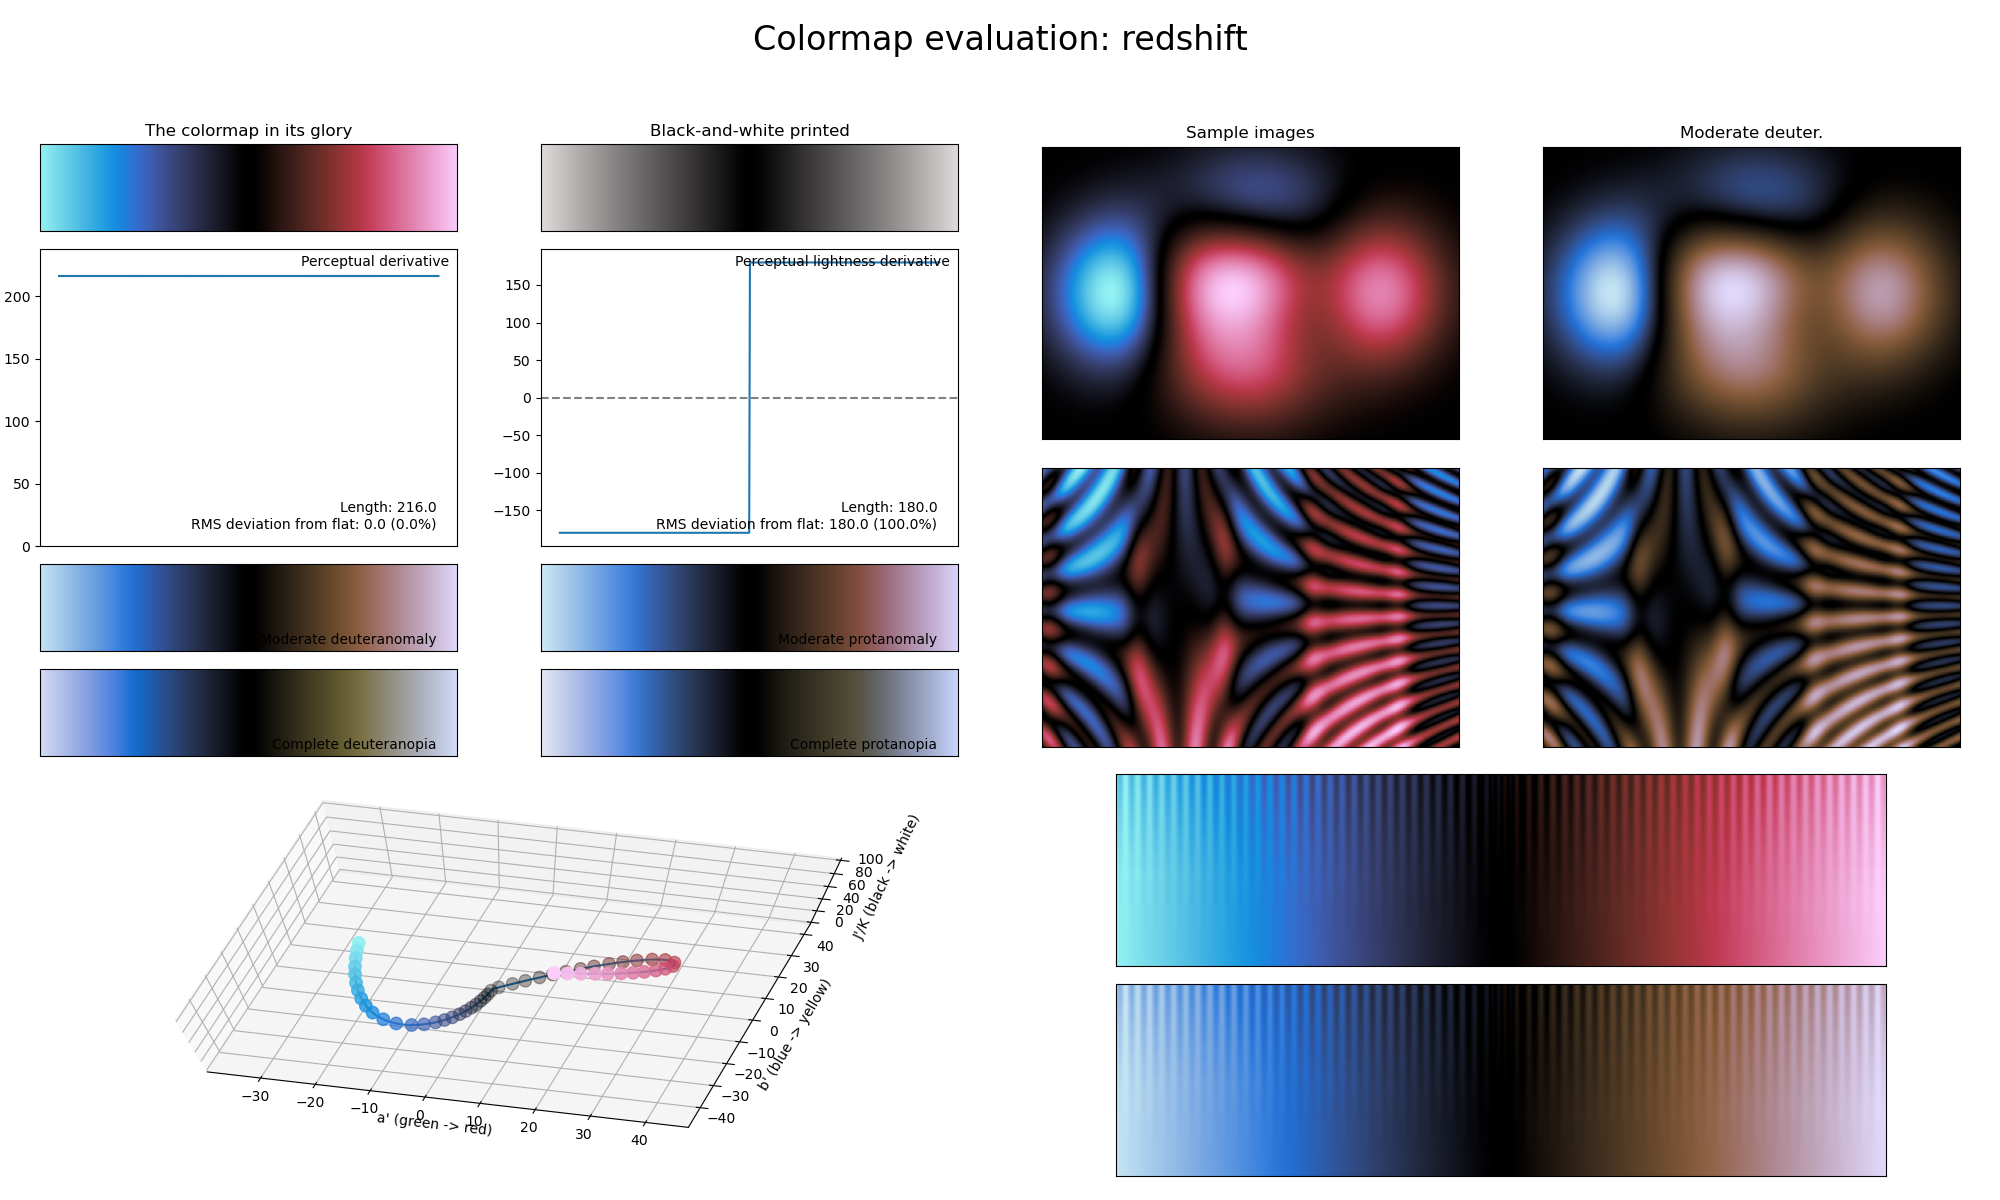
The redshift colormap is a visual representation of the (mostly) astronomical phenomenon with the same name, where electromagnetic radiation (such as light) undergoes an increase in wavelength. It covers almost the full lightness range (i.e., \([0, 90]\)) and uses red and blue as its main colors. As with the iceburn colormap, this colormap reaches its lowest lightness value in the center.