copper

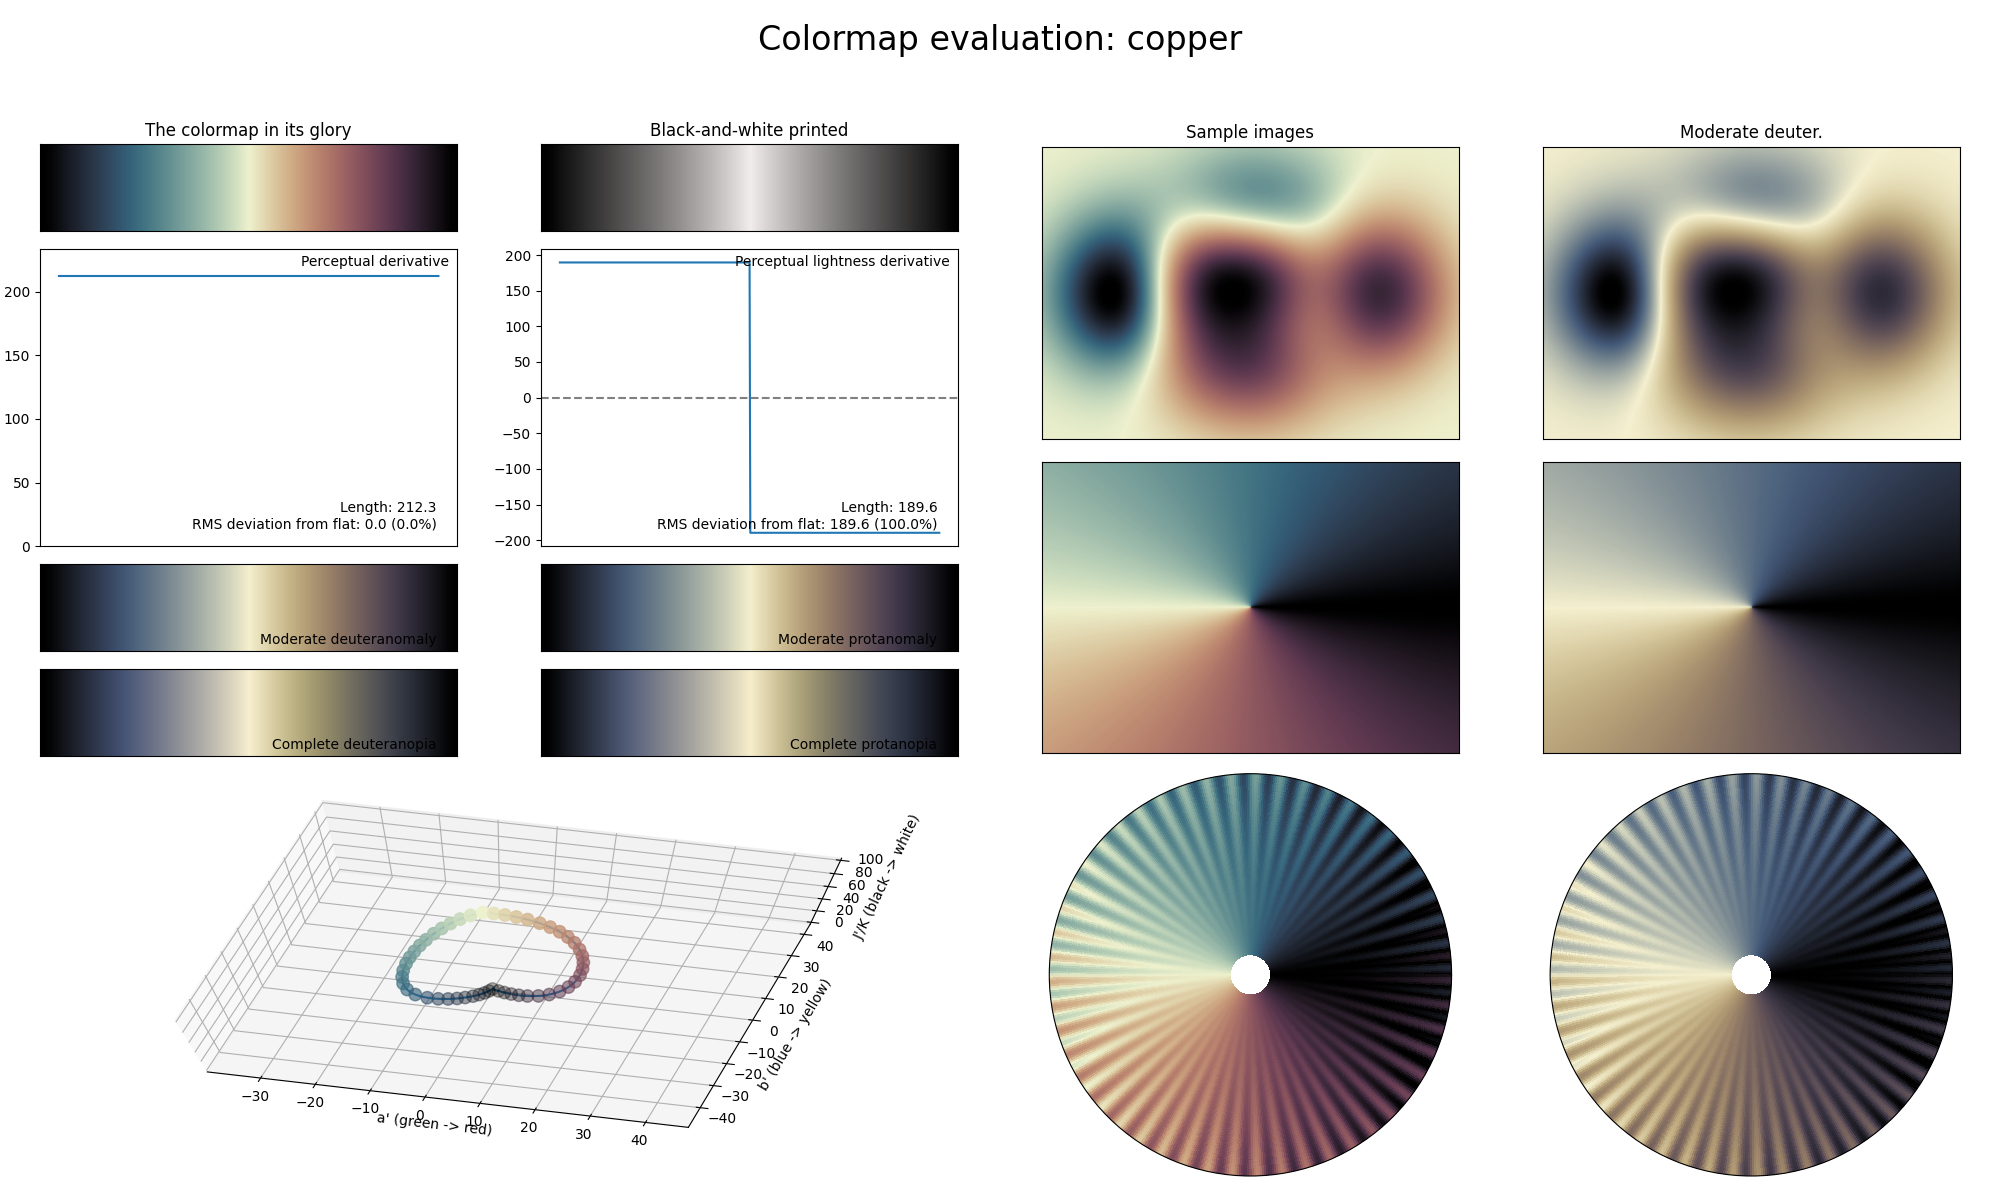
The copper colormap is a visual representation of both oxidized copper (left, like copper ore) and refined copper (right, like copper ingots). It is a cyclic colormap that covers the \([0, 95]\) lightness range, and uses basically all colors. This colormap is similar to the seasons cyclic colormap, but uses less bright colors, making it more appropriate to use in plots that have lots of information/elements. Also, like seasons, copper is not CVD-friendly.