fusion

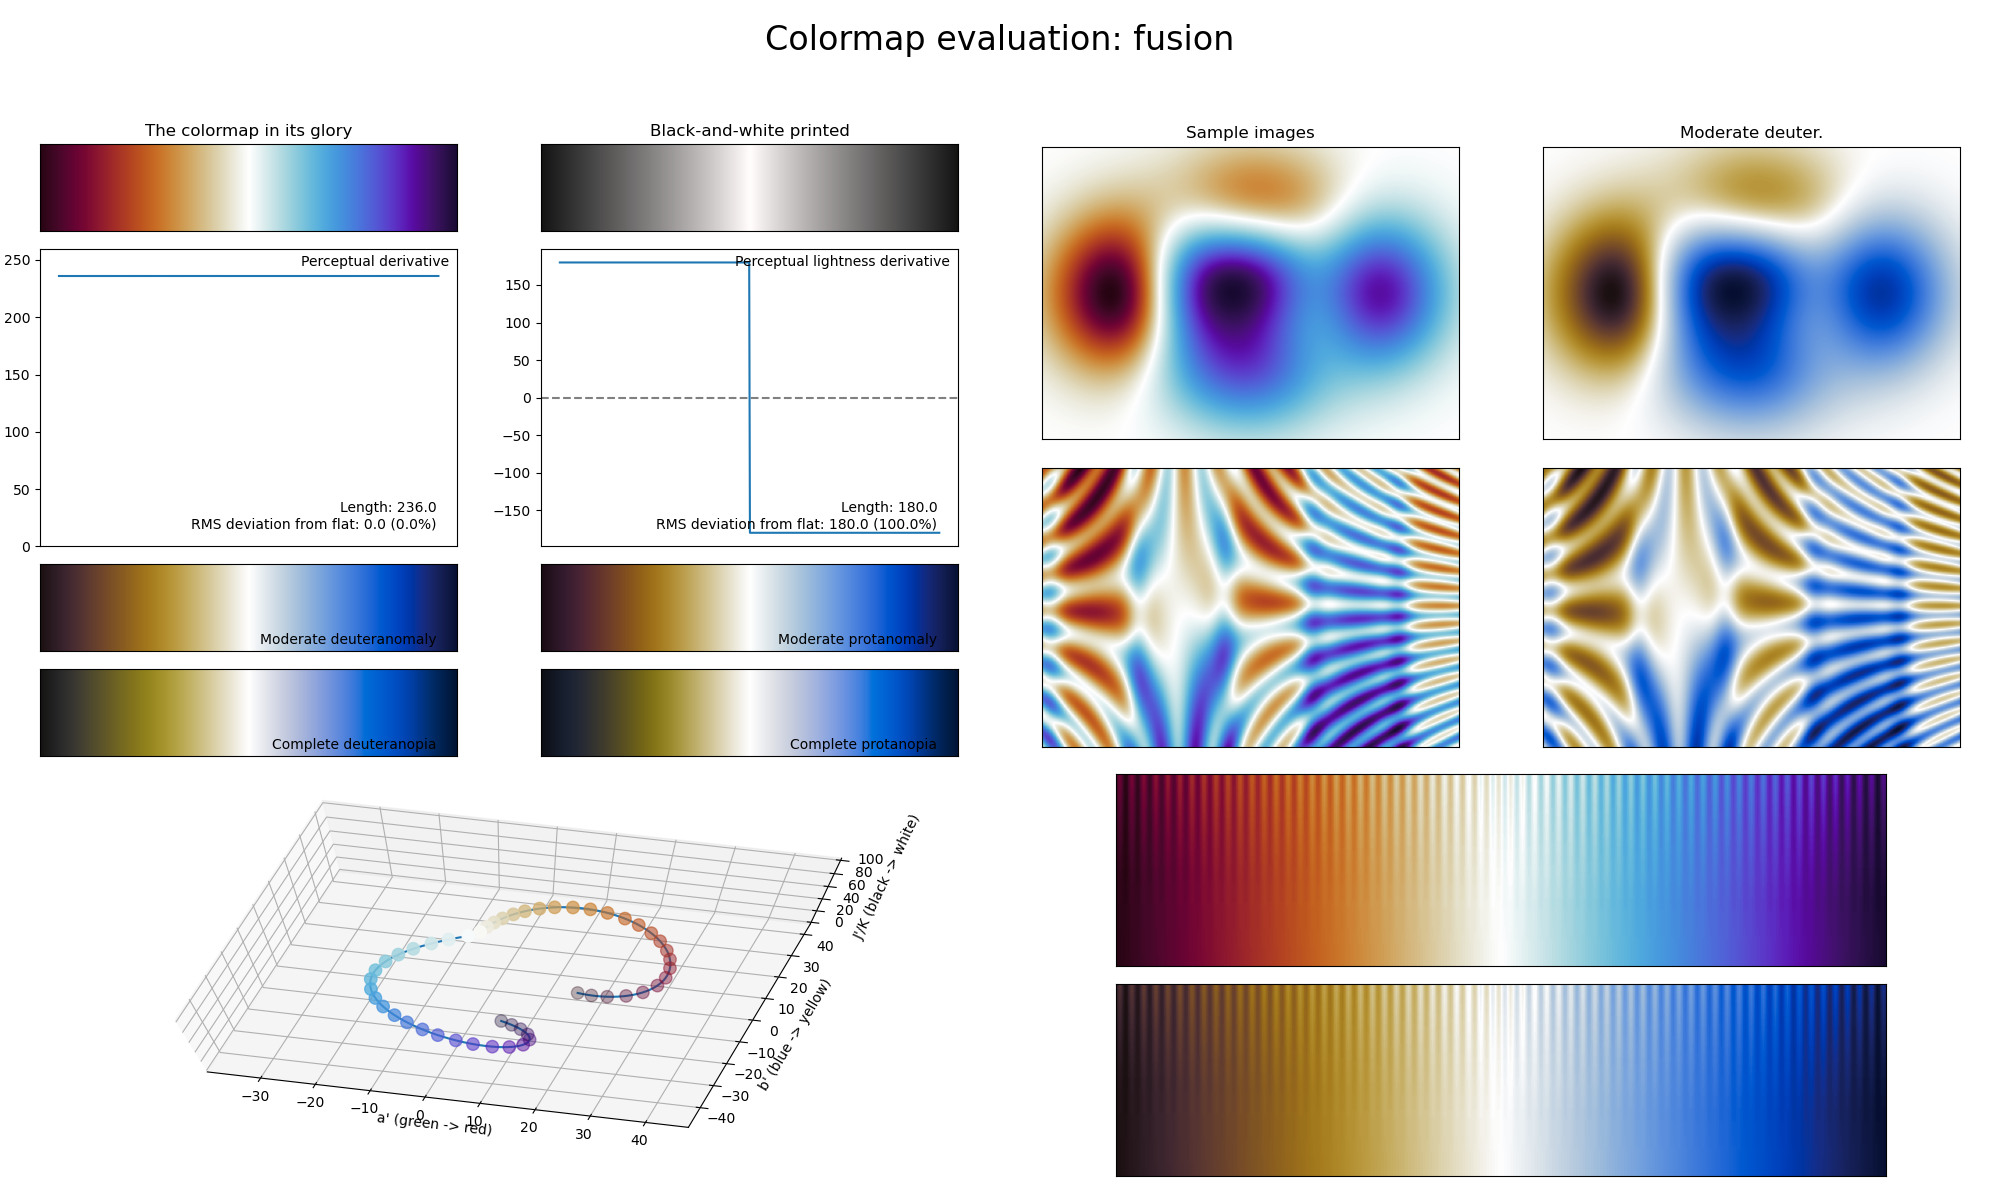
The fusion colormap is a visual representation of two particles fusing together. It covers almost the full lightness range (\([10, 100]\)) and uses the colors blue/purple and orange/red. It reaches its highest lightness value in the center and is therefore ideal for representing information where the distance to the common center should be highlighted, like in probability distribution maps.