R
The following example shows how to import and use the CMasher colormaps in R. If you use CMasher for your work in R, then please star the repo, and if you use CMasher in a scientific publication, please consider citing the CMasher paper using the BibTeX-entry found in the Community guidelines.
Big thanks to @calofost for writing this short tutorial.
First of all, we will need to clone the CMasher repository with:
$ git clone https://github.com/1313e/CMasher
If one already has cloned the repository, make sure that it is also up-to-date:
$ cd CMasher
$ git pull
We assume here that the CMasher repository is located in the current directory. Modify the paths in the following R scripts appropriately if this is not the case.
In order to use the CMasher colormaps in R, we will use the RColorBrewer package to load in the RGB values. Installing RColorBrewer is very simple:
# If RColorBrewer is not already installed, install it with:
install.packages('RColorBrewer')
With RColorBrewer, we will create an RDS object that may be loaded into any R project after creation. This RDS object only needs to be created once (and every time new colormaps have been added to CMasher). Make sure to modify the path to the location where you want to store the RDS object for future use in the following R scripts.
# Loading RColorBrewer package.
library(RColorBrewer)

# Edit following paths:
colormaps_path = './CMasher/cmasher/colormaps'
RDSfilepath = '/path/to/where/you/wanna/keep/the/RDS/object'

# Looking up the names of the scales and location of the _norm.txt files:
cmr_cmaps_files = list.files(path=colormaps_path, recursive=TRUE, all.files=TRUE,
                             full.name=TRUE, pattern='_norm.txt')
cmr_cmaps_list = list.dirs(path=colormaps_path, full.names=FALSE)
cmr_cmaps_list = cmr_cmaps_list[2:length(cmr_cmaps_list)] # Removing "." from the list of directories

# Loading all colour scales and adding them to a list object containing all scales called cmr_cmaps.
cmr_cmaps = list()
for (cmr_cmap in cmr_cmaps_list) {
  CM_RGB = read.table(file=cmr_cmaps_files[grep(pattern=cmr_cmap, cmr_cmaps_list)])
  colnames(CM_RGB) = c('R', 'G', 'B')
  assign(cmr_cmap, rgb(red=CM_RGB$R, green=CM_RGB$G, blue=CM_RGB$B))
  cmr_cmaps[[cmr_cmap]] = get(cmr_cmap)
}

# Create RDS file containing all CMasher colormaps into a single object:
saveRDS(cmr_cmaps, file=paste0(RDSfilepath, '/', 'cmr_cmaps.RDS'))
Now that we have created an RDS object, we can easily reload the CMasher colormaps with the following R script:
# Easy to load using the RDS object back into any R project using:
RDSfilepath = '/path/to/where/you/wanna/keep/the/RDS/object'
cmr_cmaps = readRDS(file=paste0(RDSfilepath, '/', 'cmr_cmaps.RDS'))
And there you go, the colormaps are now all contained within the cmr_cmaps R object list.
To access a specific colormap, we can simply use the $ operator (e.g., the rainforest colormap can be accessed as cmr_cmaps$rainforest).
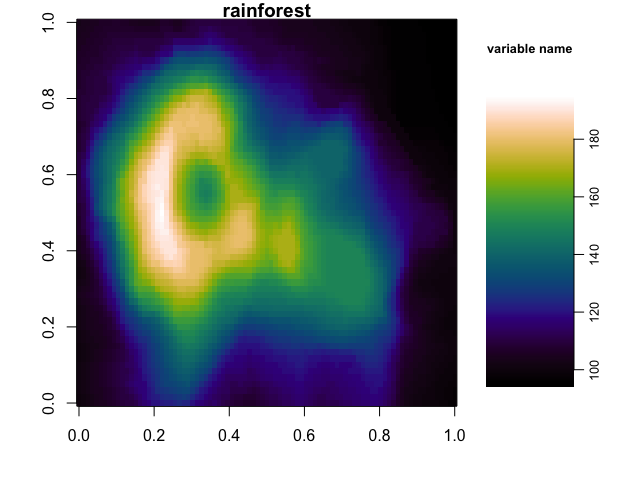
Below, we show an example of using the rainforest colormap to create a test plot (after loading in the RDS object using the script above):
# Example use (volcano is an example dataset pre-loaded in every R installation):
par(mar=c(4, 4, 1, 0.5))
layout(matrix(c(1, 2), 1, 2, byrow = TRUE), widths=c(3, 1))
image(volcano, col=cmr_cmaps$rainforest, main="rainforest")
par(mar=c(5, 1, 5, 2.5))
image(y=seq(from=min(volcano), to=max(volcano), z=t(1:length(cmr_cmaps$rainforest)),
      by=(diff(range(volcano)))/length(cmr_cmaps$rainforest)),
      col=cmr_cmaps$rainforest, axes=FALSE, main="variable name", cex.main=0.8)
axis(4, cex.axis=0.8, mgp=c(0, 0.5, 0))