wildfire

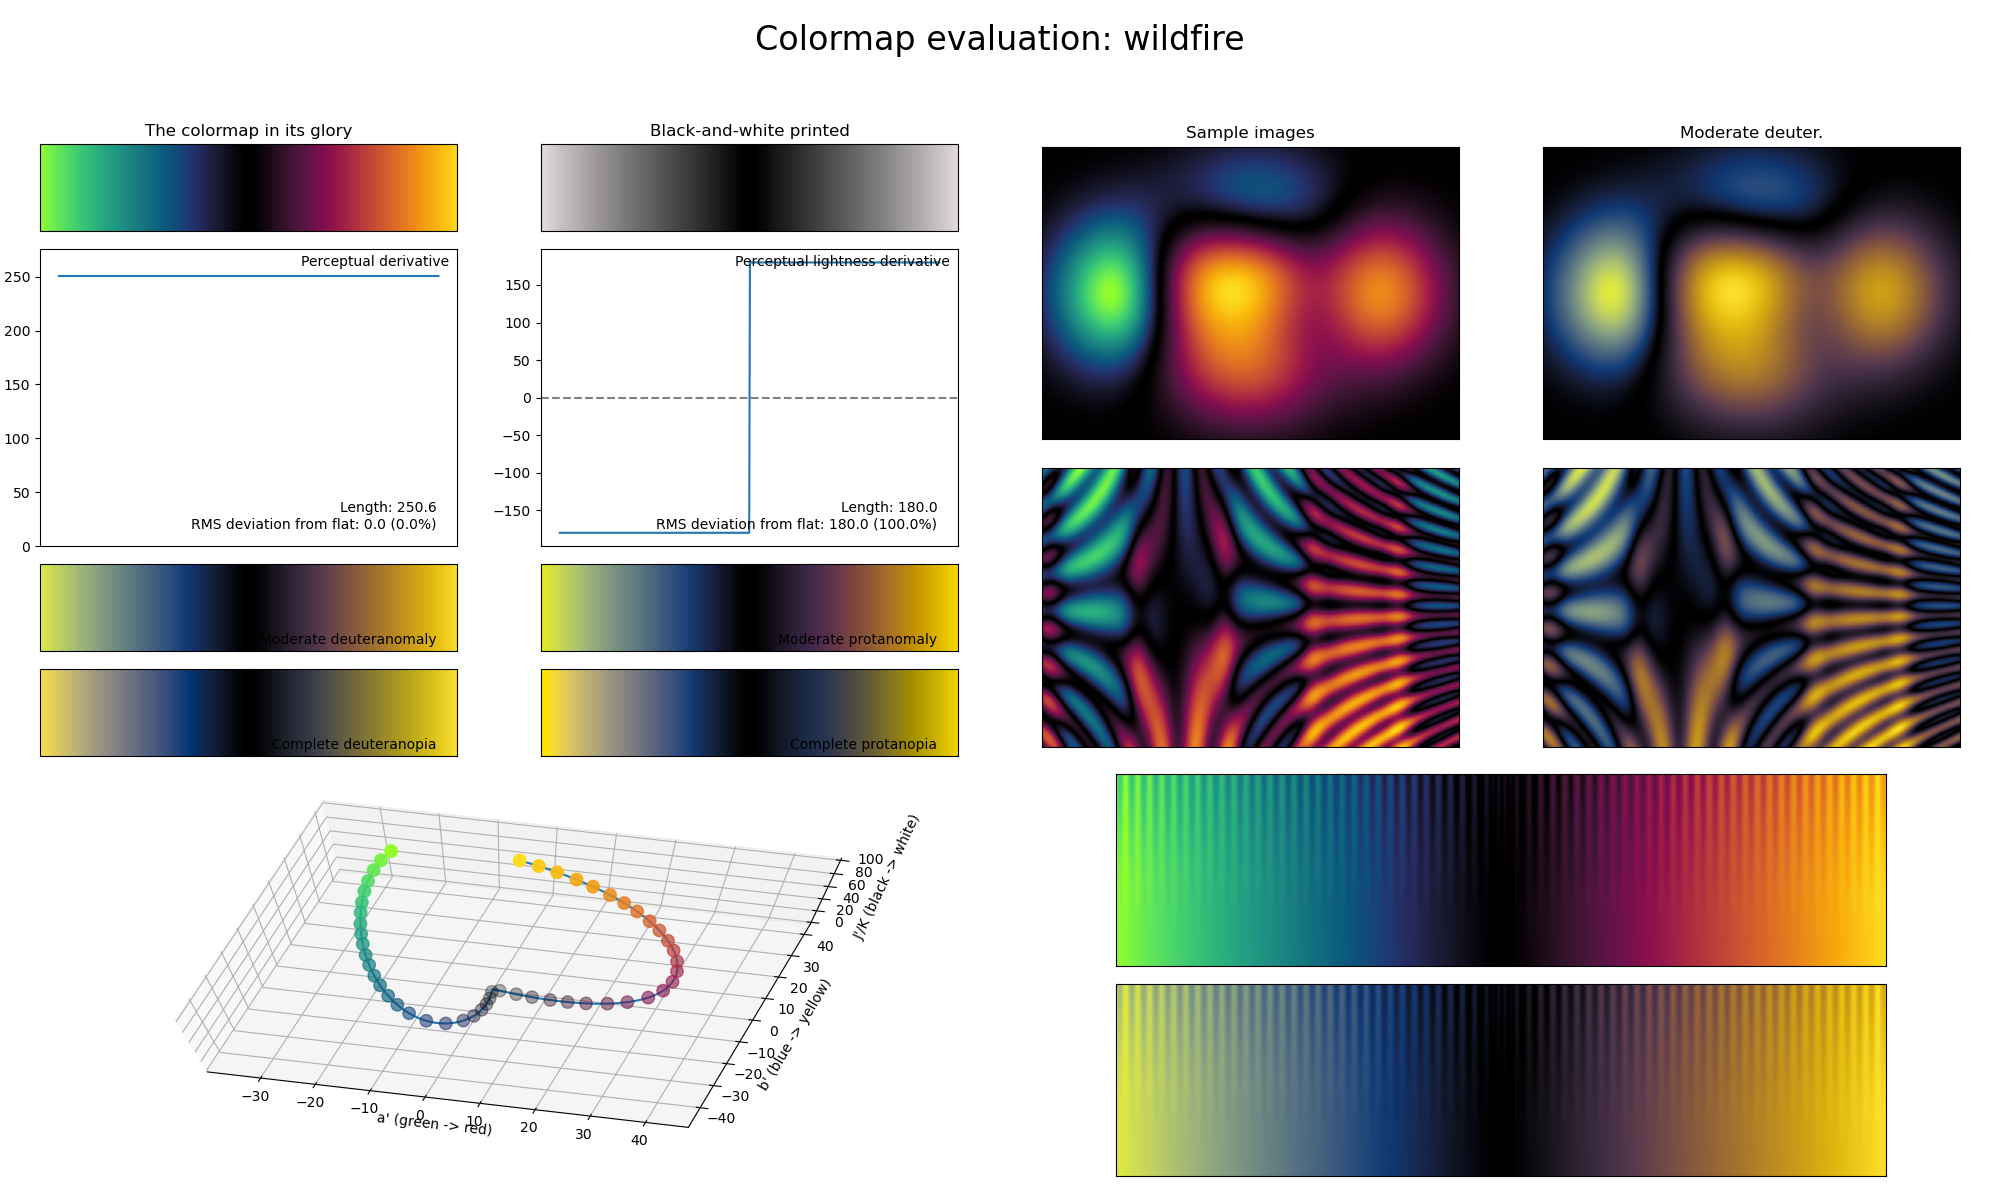
The wildfire colormap is a visual representation of the natural disaster with the same name. Like a few other diverging colormaps, it covers the special \([0, 90]\) lightness range and it uses basically all colors. Due to its exceptionally high perceptual range, wildfire is great for use in plots with very dense information. Note that, like pride and seasons, this colormap is not as CVD-friendly as other diverging colormaps. A good alternative that is CVD-friendly is iceburn.